Circuit Visualization Tools
After writing and compiling your JHDL files you can use CVT to view
and simulate the designs. There are two ways that CVT can be started.
The first is from a test bench you have
created to exercise your design. The second is using the Dynamic Test
Bench (dtb) tool. In this section we will concentrate
on the use of cvt in conjunction with dtb since writing
testbenches is an intermediate/advanced topic which is covered later in
the user's manual.
The simplest way to start up cvt using dtb is:
java dtb designName
This will run Java on dtb. dtb will first load design
designName and build it and then start up the cvt tools so you
can see what was built or simulate/netlist the resulting circuit.
When dtb loads up a design it assumes the technology desired is Virtex. If
that is not a correct assumption, start dtb with the -t
parameter as follows:
java dtb -t techName designName
This will load the design but will tell JHDL to build it for the
technology specified. Current options include xc4000, virtex, and
virtex2. If spartan, specify xc4000 and if spartan-II,
specify virtex. Other technologies will be added in the future.
When cvt initially starts up it will contain a set of pre-defined
window panels in what is called the Circuit Browser Console.
Circuit Browser Console
The Circuit Browser Console is divided into several parts. Here is an exploded view:
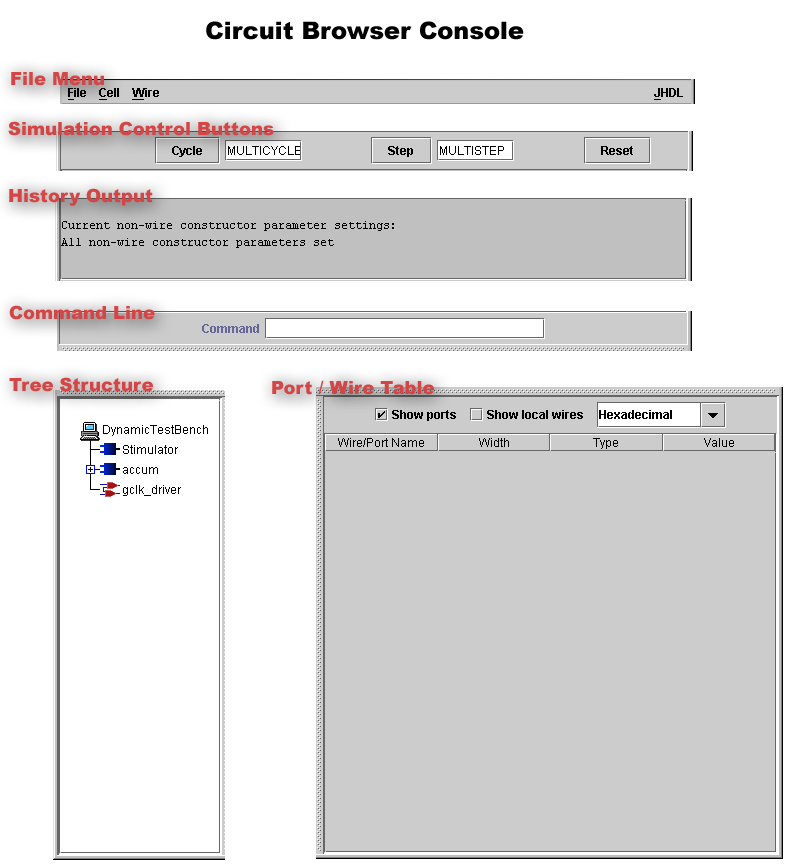
At the top are some simulation control buttons like Cycle and Reset.
Below those is the history output, where each command is echoed.
Next we have a command line for text input.
Finally, in the bottom section, we have the circuit tree
structure (left) and the port/wire table (right.)
Experiencing the Circuit Browser Console
We will now investigate the Circuit Brower Console in more detail. In you
have not yet done so, download
FullAdder.java,
NBitAdder.java
and accum.java.
Compile each of them and then invoke the Circuit Browser via the Dynamic Testbench: java dtb accum
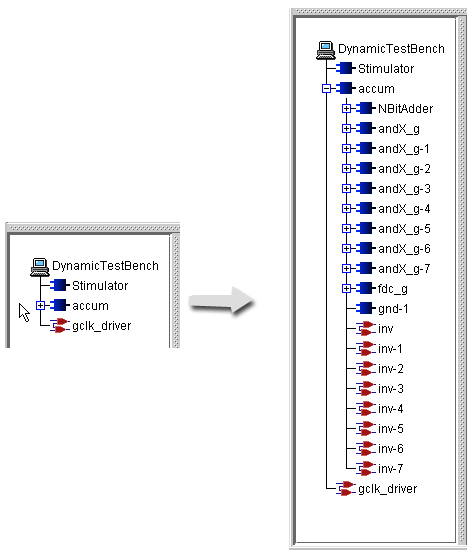
In the Circuit Browser window that appears, locate the tree structure viewer. This view is a conventional hierarchical browser -
clicking a + sign next to an element will reveal its children
in the hierarchy.
Conversely, Clicking a - sign next to an element will
hide its children.
Single-clicking on a cell in the hierarchy will
select it. Double-clicking on a cell in the hierarchy will open a viewer into
that cell's structure. Normally this is a schematic viewer, however,
clicking on a memory element will bring up a memory viewer.
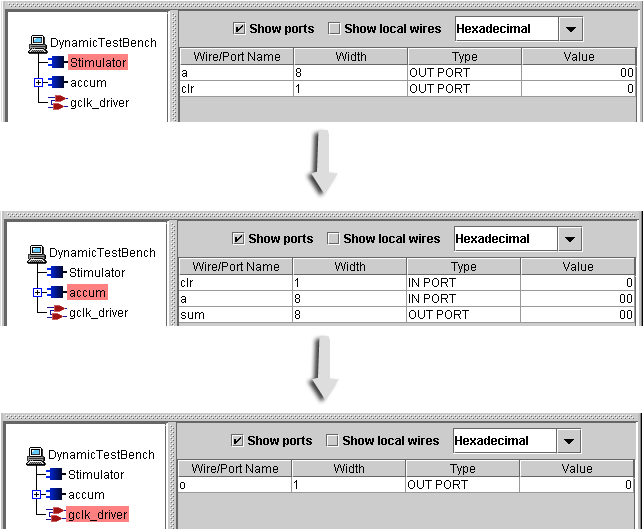
Go ahead and single-click on each of the three tree elements: Stimulator,
accum and gclk_driver. Notice how the port/wire table changes at each click.
Exploring the Schematic Viewers
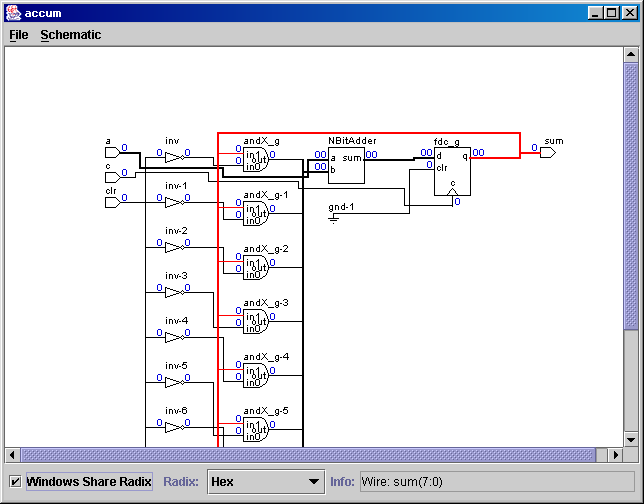
Overview: The Schematic Viewer provides a visual representation of the circuit.
It shows the insides of the cell you are viewing, including all the
ports, cells and wires. In the Schematic Viewer, you will notice
that the wires on the ports of each cell have values on them that are
drawn in blue. These value are the current values on the wires and
will stay updated as you simulate your design. You can select cells
and wires by clicking on them. To select multiple items, simply hold
down the Ctrl key as you click. When a wire is selected, it is highlighted
red. This highlighting makes tracing wires a easier for complicated
designs.
Exploration:
Single-click on the + sign next to accum. All of accum's children
now appear. Now double-click on accum. The schematic that pops up is the top level
schematic.
Click on any wire and notice how the wire changes color (to red) along
the length of the wire.
This is useful in verifying connections.
Next, double-click on the NBitAdder. Its schematic now appears:
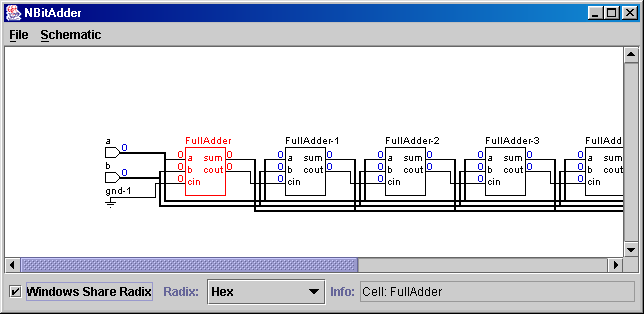
In this new window, double-click on any of the FullAdders to see their
respective components and interconnections.
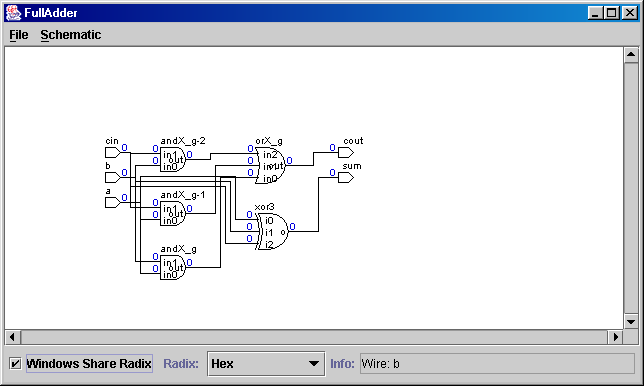
The Schematic Viewer has an Info box that describes the cells and
wires which are highlighted, or the cells which the mouse has rested upon for
a second or two. Normally the Info box tells you the name and
size of the objects. If you select the Schematic menu option View
Cell Properties or View Wire Properties then you will
also see the properties of the cells or wires (if you have explicitedly assigned
them properties) in the Info box.
When the schematic viewer is opened, all the values are displayed in
hexidecimal format. This can be changed by using the Radix pulldown
box at the bottom of the Schematic Viewer. The options available are
Hex, Decimal, Signed Decimal, or Binary. By default, all the Schematic
Viewers that are open share the same Radix, but if you unselect the
check box Windows Share Radix then you can set different
Schematic Viewers to display the values in different Radixes.
The option to view all cells, available as a checkbox under the
Schematic menu option is handy for debugging a circuit. If logic exists
in your circuit that does not affect the circuit outputs, it will not be displayed
(and for that matter, it will be optimized away during netlisting.) To see those invisible
cells, check the box beside View All Cells.
Exploring the Port/Wire Table
Go ahead and close all of the schematic viewers you opened.
In the Circuit Browser Consol, the port/wire table lists
all the ports and/or wires for the cell currently selected in the tree
structure viewer. Later, as you cycle the simulator you will notice that the
port table updates the port's wire values to reflect the current values. Double-clicking on a
wire in the table will add it to the Waveform viewer.
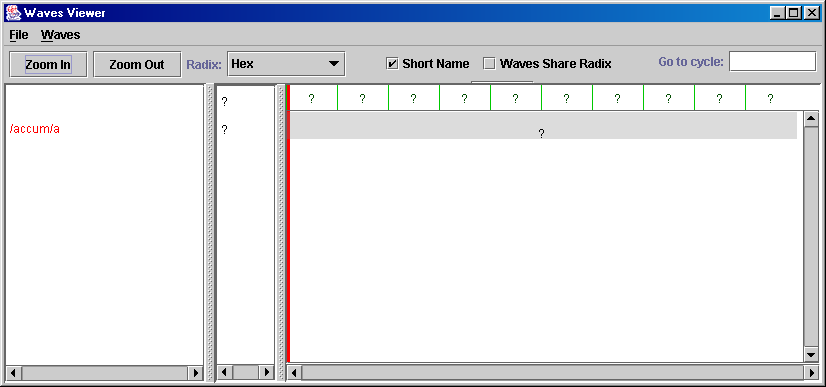
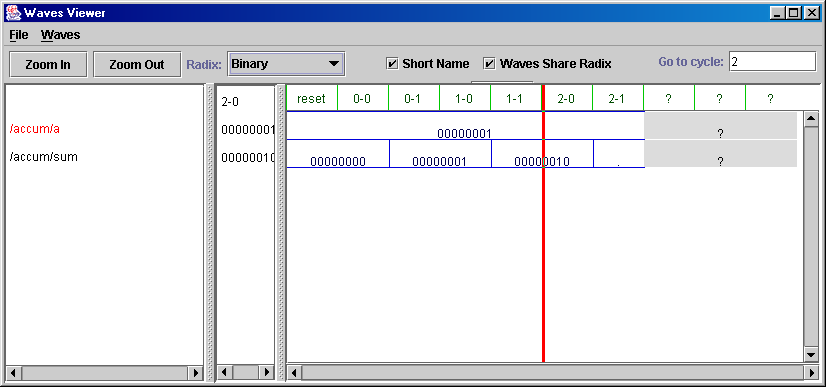
Discovering the Waves Viewer (aka Waveform Viewer)
The Waves Viewer is used to watch the values of specific wires over
time. The Waves Viewer can be opened by double-clicking wires in the
Circuit Browser's port/wire table, or double-clicking wires in the
Circuit Viewer, or from the command line typing watch [wire
name]. Wires can be added or removed from the Waves
Viewer as desired. When a wire is added to the Waves Viewer nothing
is known about the past values of the wire so the only values that
will chow up are current values and then as you run your design using
step or cycle new values will show up. The Waves Viewer is divided
into three parts. The left part contains the wire names.
The right part contains the values of the wire over a period of
time. In this table there is a red vertical marker that moves to
where you click or drag the mouse. The middle part shows the values
of the wire or the cycle that the marker is moved to.
Each wire in the Waves Viewer displays all its values in the same
radix. Originally the values are displayed in hexidecimal. You can
select a wire by clicking on the wire names. The selected wire will
appear red. After selecting a wire you can change the radix used to
display the values on the wire by making a selection from the pop down
menu box on top of the viewer. The choices are hex, decimal, signed
decimal, binary or the Custom Format.
There are also options to zoom in, zoom out, and to see the full
hierarchical name or the short name.
Single-click on accum. The port/wire table shows clr, a and sum. Let's explore the waveform viewer.
In the Command box, type
put a 1
and hit enter. Next, double-click on the a row in the
port/wire table to launch the waves viewer with a now added to it's list of monitored
wires/ports.
Switching to the Console window, double-click on the sum row to add that wire to the
waves viewer as well. Then click on the "Cycle" button a few times and notice how the Waves Viewer window
updates to display the new values on each wire.
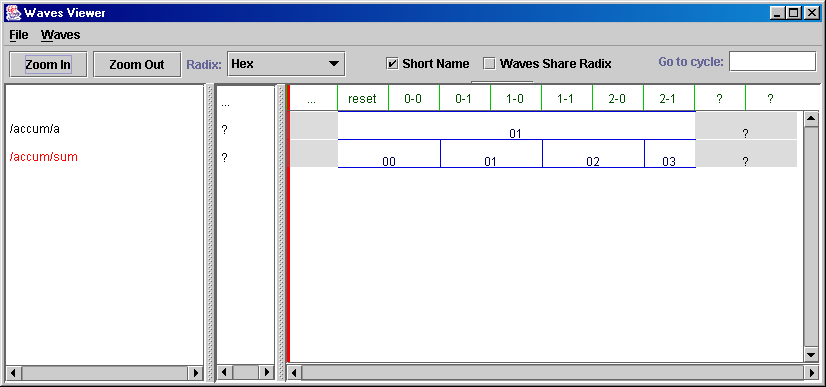
Exploring further the Waves Viewer window, click on the zoom in and zoom out buttons to focus in or out
on the waves. Change the Radix from Hex to Binary or Decimal. Type "2" and press enter in the
"Go to cycle" box to jump to that cycle on the waveforms.
Clicking on a wire to highlight it (in red),
then choosing the menu item "Waves" and "delete wire," removes a wire from the waves Viewer.
The last button, to the right of the radix checkbox, save allows you to save the data (in
the waves viewer) as a text file. It saves the cycle names across the
top of the text file. Each succeding line in the file will have a wire name
and all the values of the wire for each cycle. Once you have
closed down CVT, you can open up just the Waves Viewer with this text
file. To do this type java waves [text file with waves
data]. The Waves Viewer will load up, but it will not have the
cycle and step buttons or the Commands bar. This is because the Waves
Viewer can not simulate without the rest of CVT.
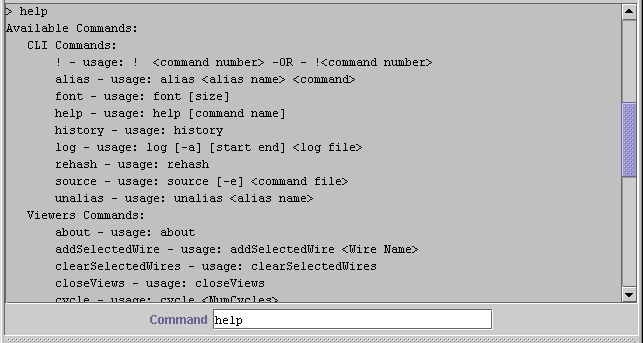
The Command Line

The middle command line section of the circuit browser console is for textual
input. The text field, immediately above the Command textbox, is the history/output field.
Here is where you can see a history of your commands to CVT
and where you will see error messages. If a command does not work it will report why it failed in
the text box. It will also report errors in the simmulation of your
circuit. Previously entered commands are accessable via the up and down arrows.
Typing "help" will provide a list of commands available for use. Typing "help commandName" will provide a detailed
description of a particular command.
Simulation Control Buttons

At the top are Cycle, Step, and Reset buttons to control the
simulation. Clicking the Cycle or Step buttons always performs that action only once.
Cycling or stepping by more than a value of 1 can be accomplished by typing text into the boxes next
to the buttons, and then pressing 'Enter' after the value.
Common Features
All the Viewers in CVT share some common features. At the top of each
viewers there is a menu bar. The File Menu always has the option of
closing the window or exiting out of CVT. The rest of the menu
options are specific to the viewers they are in.
File Menu
You can open other viewers from the Circuit Browser. To open a schematic
viewer single-click the cell you wish to view in the tree structure and in
the Cell menu, select View Cell Schematic.
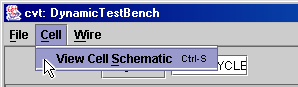
Another way to
open a schematic viewer is to double-click a cell.
To open the Wire Waves Viewer you can double-click wires you want to watch
in the port/wire table or select the Wire menu option Watch
Wire.
Scripting and Logs
The CVT console remembers the textual and GUI commands that you perform as you load and
simulate a circuit. You can save all or just a range of these commands as a script
file with the "log" CLI command.
To find out more about this command, type
help log in the Command box.
The history/output textbox displays
|
> help log
Help for log:
Usage:
     log [-a] [start end]
Description:
     This command will write a log file of all successful commands issued
during the current session. this file can then be sourced during a
subsequent session.
|
The -a appends to a file. start and end are integers representing the
beginning and ending command you want included into your file.
Entering log 1 5 myCommands.txt
writes the first through fifth successful
commands to the file myCommands.txt. Later, perhaps in a different session,
you can then execute those commands by running source myCommands.txt
from the
Command input box. This is a particularly useful feature, as it allows
you to script your common procedures in CVT. In CVT, everything is scriptable.
Custom Format of Wire Values
The wire table viewer in the CVT window has an editable dropdown box, to
determine the form of the values on the wires.
Besides those options listed, you can optionally enter your own
format string. These format string are similar to the C printf's statement.
Highlight the wire(s) (shift selects ranges, control selects specific ones),
and the enter in your format string. Here are a couple examples:
- %u[7:4.3:0] - diplays a 4.4 fixed point number as in unsigned
decimal. Bits 7 to 4 represent the whole part and bits 3 to 0
represent the fractional part.
- %8d[15:8] - diplays bits 15 through 8 as a signed decimal
number. The resulting String will be at least 8 characters long.
- %h[*] - displays the value as a hex number. The * says to do this
with the whole width of the wire.
To learn more about the BVFormat strings see the BVFormat Documentation.
GUI Commands (some not available in all windows)
File Menu
Close <Ctrl+W>
- Closes the current window or if in Console Browser window, exits
Exit <Ctrl+X>
Cell Menu
View Cell Schematic... <Ctrl+V>
- View schematic of selected cell
Wire Menu
Watch Wire... <Ctrl+A>
- View wire waveform window
Waves Menu
Delete Wire <Ctrl+D>
- Removes the selected wire from the waves viewer.
Schematic Menu
View All Cells
- Shows cells that do not effect output and would be optimized away. The schematic viewer draws all these cells in the top left corner.`
View Cell Properties
- When selected this changes the cell names to include the cell properties so you can see the properties on the cell in the info box.
View Port Wire Properties
- When selected this changes the wires on the ports names to include the wire properties so you can see the properties on the port wires in the info box.
Zoom In <Ctrl+I>
Zoom Out <Ctrl+O>
View All <Ctrl+F>
- Changes the size of the circuit to fit into the circuit view window.
Available Console Commands
The following is a list a few example commands found in JHDL.
These commands may be subject to change as JHDL is developed.
These commands are available to be executed from the command line. One
of the features of CVT is that it is full scripted. There is no command
restricted to only GUI use. A more complete form of help is supplied in
CVT by typing help or help < command name > on the command line.
CLI Commands
! <command number > -OR- ! < command >
alias < alias name > < command >
font [ font size ]
- Changes font size to the specified size if entered and tells you the current font size.
help [ command ]
- Displays a list of commands if no command is specified, or if a command is specified it tells you how to use it.
history
- Prints up the history of the comamnds you have used.
log [ -a ][ start end ] < log file >
- Creates a log file of all successful commands. This can be run latter using the source command.
rehash
- Rehashes the class path for class name completions.
This command is for internal support of JHDL, and is rarely employed
by the end JHDL user.
source [ -e ] < log file >
- Executes a log file (a script file with recognized CLI commands.)
unalias < alias name >
CVT Commands
about
- Displays information about JHDL
addSelectedWire
- Adds the selected wire to the waves table
clearSelectedWire
- Clears (removes) the selected wire from the waves table
closeViews
- Closes open schematic, memory, waves and registered custom viewers
cycle < cycles >
- Cycle the system < cycles > times
getSelectedCell
- Used mainly internally, this command returns the currently
selected Cell to other CLI commands.
getSelectedWires
- Used mainly internally, this command returns the currently
selected Wires to other CLI commands.
quit (exit)
reset
- Assert the simulator's reset
setSelectedCell
- Used internally, for GUI interaction, this command marks a Cell as being "selected."
setSelectedWire
- Used internally, for GUI interaction, this command marks a Wire as
being "selected."
step < steps >
- steps the system < steps > times
view < cell name >
- View schematic of < cell name >
viewcell < Cell Name >
viewmem < Memory Name >
watch < wire name >
- Watch < wire name > in waveform viewer.

JHDL 0.3.45
Copyright (c) 1998-2003 Brigham Young University. All rights reserved.
Last updated on 11 May 2006